


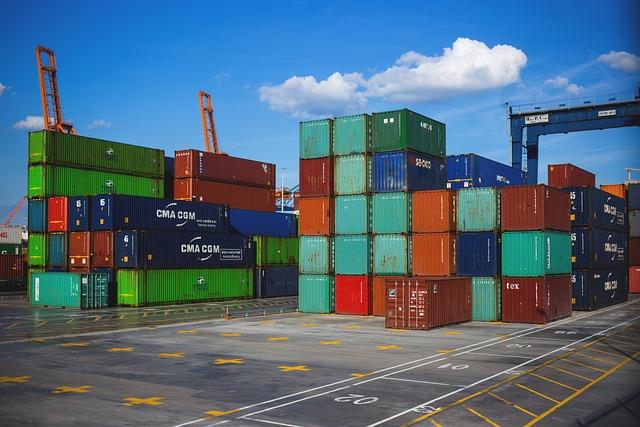
US Container Imports Slip 6.5% in February, Yet Volumes Stay Near Historic Highs
Data from logistics analytics firm Descartes Systems Group shows US container imports fell 6.5% in February versus the same month last year. Even with the decline, inbound shipments registered as the fourth-largest February total on record, highlighting resilient demand amid shifting supply-chain conditions.
Snapshot: What February’s Numbers Tell Us
February’s dip reflects a complex mix of seasonal adjustments and ongoing congestion issues at key gateways. Retailers and manufacturers are still managing inventory normalization after an unusually busy start to the year, while persistent operational bottlenecks have tempered throughput. Key takeaways from the month include:
- Top ports by volume: Los Angeles, Long Beach and Savannah remained the busiest entry points for containerized goods.
- Sector trends: Categories such as consumer electronics and apparel saw softer import growth compared with last year.
- Operational headwinds: Port delays and labor constraints continue to influence timing and routing decisions.
Port-Level Volumes (February)
| Port | February 2024 Imports (TEUs) | Change from Jan (%) |
|---|---|---|
| Los Angeles | 320,000 | -5.2% |
| Long Beach | 260,000 | -7.1% |
| Savannah | 185,000 | -4.5% |
Drivers Behind the February Decline
Several interrelated factors explain why US container imports slowed in February even as aggregate volumes remained high:
- Seasonal inventory realignment: After the holiday season surge and a strong January, many retailers trimmed replenishment orders to rebalance stock levels.
- Terminal congestion and workforce shortages: Intermittent delays at major ports and sporadic labor constraints reduced handling capacity and shifted arrival patterns.
- Macroeconomic caution: Inflationary pressures and geopolitical uncertainty prompted more conservative procurement by businesses.
- Shifts in offshore production: Variability in manufacturing output—particularly in Asia—led to uneven export flows to the U.S.
| Factor | Typical Effect |
|---|---|
| Seasonal Inventory Adjustment | Temporary pullback in orders after peak season |
| Port Congestion | Delays and re-routing of shipments |
| Cost Volatility | Smarter, lower-frequency ordering patterns |
| Global Production Dynamics | Uneven supply availability |
What This Means for Supply Chains and Retailers
Although headline imports were down 6.5% year-over-year, the fact that volumes remain elevated means businesses cannot assume a return to low-demand conditions. The mix of high absolute volume and greater variability produces unique operational challenges:
- Delivery windows are less predictable, increasing the value of flexible logistics planning.
- Retailers that rely on just-in-time replenishment face stockout risk during promotional periods unless they add contingency buffers.
- Transportation and freight rate swings could create short-term price shocks for end consumers.
- Real-time visibility into inventory in transit becomes more important for maintaining service levels.
Think of the current situation like a city street after a major event: traffic volumes remain high compared with a typical day, but lane closures and reroutes cause irregular flow—businesses must plan for both elevated demand and inconsistent throughput.
| Sector | Short-Term Challenge | Recommended Response |
|---|---|---|
| Logistics Operators | Unpredictable arrival patterns | Flexible routing & contingency berths |
| Retailers | Potential promotional stock gaps | Advance purchasing & safety stock |
Practical Strategies for Importers and Carriers
To preserve service levels and control costs as the market fluctuates, stakeholders should adopt a multi-pronged approach that balances agility with data-driven planning:
- Increase end-to-end visibility: Deploying advanced tracking and predictive ETA tools helps identify disruptions early and allows proactive re-planning.
- Widen gateway options: Using alternative ports and inland intermodal connections can reduce exposure to bottlenecks at primary terminals.
- Adopt inventory flexibility: Combine strategic buffer stocks with demand-sensing to lower carrying costs while avoiding stockouts.
- Forge collaborative partnerships: Closer alliances with carriers and tech providers can secure capacity and improve negotiation leverage.
| Strategy | Actions | Expected Outcome |
|---|---|---|
| Visibility | Install real-time tracking & predictive analytics | Faster disruption response |
| Route Diversification | Test alternate ports and multimodal legs | Reduced congestion exposure |
| Inventory Agility | Mix safety stock with vendor-managed replenishment | Improved fill rates with lower risk |
| Partnerships | Negotiate framework agreements with carriers/tech firms | Greater capacity certainty & cost stability |


:
– Booted from Love Island USA, Alannah Keyser Apologizes for Using a Racist Slur
– Alannah Keyser Issues Apology After Being Fired from Love Island USA Over Racist Slur
– Controversy on Love Island USA:")
